Market research > 50 in 50: New York, Ohio, and Pennsylvania
50 in 50: New York, Ohio, and Pennsylvania
At-a-glance snapshots of key market indicators in various market sectors and geographies.

50 in 50: New York, Ohio, and Pennsylvania
50 states in 50 weeks: U.S. states economic and infrastructure highlights.

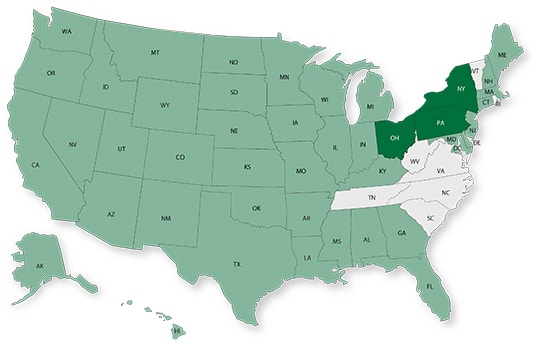
Our team is putting together new content and a different format to kick off 2023 Word on the Street. For that reason, we will be publishing the remaining states of the 50 In 50 Series in a combined fashion. This week we are featuring New York, Ohio, and Pennsylvania.
Key Economic Indicators
| Measure | New York | Ohio | Pennsylvania |
| GDP (billions) | $1,491.8 | $615.4 | $713.7 |
| GDP 5-year CAGR (U.S.: 1.6%) | 1.2% | 1.0% | 0.7% |
| GDP per capita (U.S.: $58,154) | $76,418 | $52,927 | $56,014 |
| Population (millions) | 19.8 | 11.8 | 12.9 |
| Population 5-year CAGR | 0.3% | 0.2% | 0.3% |
| Unemployment (U.S.: 3.7%) | 4.4% | 4.2% | 4.0% |
| Economic outlook ranking | #50 | #19 | #37 |
| Fiscal health ranking | #41 | #26 | #38 |
| Overall tax climate ranking | #49 | #37 | #29 |
* Compounded annual growth rate (2017-2021)
Top three industries by GDP Growth (last five years):
| # | New York | Ohio | Pennsylvania |
| #1 | Information | Mining, quarrying, and oil and gas extraction | Management of companies and enterprises |
| #2 | Management of companies and enterprises | Agriculture, forestry, fishing and hunting | Information |
| #3 | Finance and insurance | Finance and insurance | Manufacturing |
Areas with the highest population percentage increase in 2021 vs. 2020:
| # | New York | Ohio | Pennsylvania |
| #1 | Kingston, NY Metro Area | Columbus, OH Metro Area | Harrisburg-Carlisle, PA Metro Area |
| #2 | Poughkeepsie-Newburgh-Middletown, NY Metro Area | Mansfield, OH Metro Area | East Stroudsburg, PA Metro Area |
| #3 | Watertown-Fort Drum, NY Metro Area | Coshocton, OH Micro Area | York-Hanover, PA Metro Area |
Infrastructure Highlights
New York received a ‘C’ grade in its 2022 ASCE report. Roads, transit, and wastewater infrastructure systems were considered to be in poor condition. To date, approximately $5.5 billion has been announced for roads, bridges, safety, and major transportation projects as part of the Bipartisan Infrastructure Law (BIL) in the state. This month, in an effort to fund critical water infrastructure projects, the state announced over $300 million towards the following grant programs: Water Infrastructure Improvement Grant, Intermunicipal Grant, Green Innovation Grant, and Engineering Planning Grant.
Ohio had seven categories rated as poor in last year’s ASCE report. Drinking water, hazardous waste, inland waterways, levees, roads, stormwater, and transit dragged the state’s grade down to a ‘C minus.’ Nevertheless, progress is being made in several fronts. According to the ARTBA, after one year of BIL, Ohio has started 1,665 transportation projects and $241 million has been announced thus far to fund water projects. Ohio is also making headway on its plans to implement electric vehicle infrastructure. ODOT is now accepting proposals for installation and operation of charging stations throughout the state.
Pennsylvania’s grade in 2022 remains a ‘C minus’ (the same as the 2018 ASCE report card). The state has made good progress but will need to pay special attention to bridges, drinking water, stormwater, transit, and wastewater as those categories received poor grades on the assessment. Of all U.S. states, Pennsylvania has the second highest number of bridges in poor condition. Another growing concern is the fact that one-third of the water systems tested for PFAs were found to have unsafe chemical levels.
AE Industry
| AE Industry Metric | New York | Ohio | Pennsylvania |
| ENR 500 firm headquarters | 34 | 23 | 24 |
| M&A buyers since 2018 | 184 | 62 | 87 |
| M&A sellers since 2018 | 86 | 55 | 77 |
For customized market research, contact Rafael Barbosa at [email protected] or 972.266.4955. Connect with him on LinkedIn.
Subscribe to our Newsletters
Stay up-to-date in real-time.


