Word on the street > Issue 103
Word on the Street: Issue 103
Weekly real-time market and industry intelligence from Morrissey Goodale firm leaders.

AE Industry Recode: 500-15-90-174
Last week, Engineering News-Record (ENR) released its annual list of the industry’s Top 500 Design Firms. Perennially, the list has charted the fortunes and changing nature of the design industry. Compiling the list and interpreting the information is a massive and important undertaking by the ENR researchers and journalists. The list’s importance in shaping and benchmarking the industry cannot be overstated. This year it also reveals how the industry is changing and the pace of that change. Let’s decode what’s happening in the industry by looking at some of the numbers from this year’s Top 500.
500: Over time, the list itself has become a touchstone for aspirational industry firms. (There’s many AE firm strategic plans that begin with “Our vision is to be an ENR Top 200 firm by 2027!”) It’s the Match.com for the many private equity and family offices that are looking to find the perfect design firm platform to invest in the AE industry. Visit their offices and on their desks right beside Fortune and Forbes you’ll find Engineering News-Record. It’s the Tripadvisor for strategic acquirers from around the globe. (“We need to acquire a leading infrastructure firm headquartered in North Carolina. Where can we find the names of those firms?”) The Top 500 list is both the starting point and a reflection of the changes in the industry.
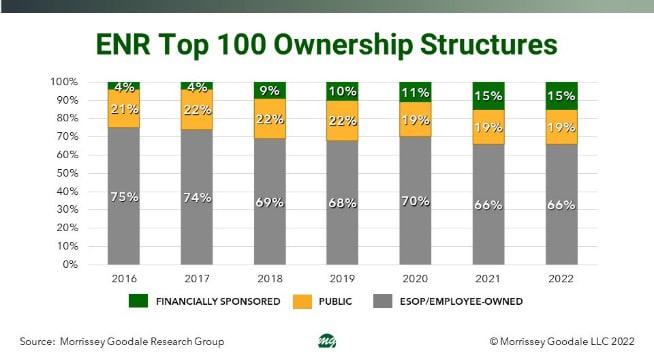
15: This is the percentage of the ENR Top 100 firms that is capitalized by private equity (Figure 1). (It’s 13.5% for the Top 200.) The speed at which the private-equity model has been adopted by the industry’s largest design firms has been stunning—almost quadrupling from just 4% in 2016. Over the same period, the number of Top 100 design firms that directly or indirectly are publicly traded has remained pretty constant at between 19 and 20 each year. However, the employee-owned and/or ESOP capitalization model has steadily declined in popularity among the industry’s top designers. Just two-thirds of the ENR Top 100 are now employee- and/or ESOP-owned—down from three-quarters in 2016. Will this recapitalization of the industry’s leading design firms continue? The next number suggests that it will.
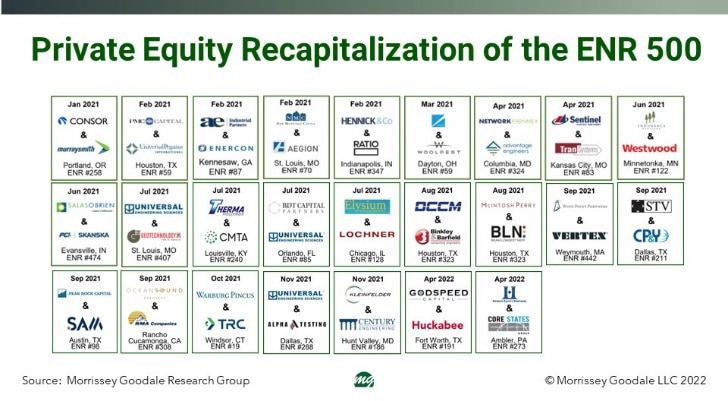
90: That’s the percentage of sales or recapitalizations of ENR Top 500 firms in calendar 2021 that involved private equity. (It’s also coincidentally the same percentage for the 12 months ending April 30, 2022.) Figure 2 below shows the 25 ENR Top 500 Design Firms acquired or recapitalized by private equity since January 2021. What happens if this 90% number holds up going forward? Well, we’re projecting that on average between 25 and 30 of the ENR Top 500 firms will sell or recapitalize every year through the end of 2026. Assuming 90% of those firms choose private equity, then it’s likely one-third of the industry’s top designers will no longer be employee-owned within four-and-a-half years and will instead be capitalized by outside equity.
174: This is the position on the Top 500 list occupied by DCCM (Houston, TX). DCCM stands for Design, Consulting, Construction Management. The firm was not on the list last year. In fact, DCCM didn’t even exist as an operating firm two years ago. Rather, it was a plan, an intention, a thesis on the part of a private equity group. In 2020 and 2021, that group invested in and acquired five design firms in Texas, California, and Georgia (R.G. Miller Engineers, Miller Survey Group, Binkley & Barfield, Coastland, and Rochester) and along the way created DCCM. The time from “idea” to Top 200 design firm was less than two years. This rapid growth pattern is seen in the other private equity-backed firms on the Top 500 list. Collectively their average annual growth rate outstrips the rates of the publicly traded and employee/ESOP-owned designers.
Where is this all heading? Our research and work suggest that private equity will continue to recapitalize the design industry at a rapid clip over the next five years. As one private equity director said to us last week when asked what she sees ahead given stock market gyrations and rising interest rates: “Rising interest rates are having zero impact on the way we are doing, viewing, or valuing deals. We are cash buyers.”
Industry M&A is up 40% over the past 12 months: Last week saw new transactions announced in PA, FL, NY, MA, IL, TX, and UT.
Questions? Insights? Email Mick at [email protected] or text him at 508.380.1868.
Want To Catch A Big Wave? Get In The Mood
There are waves out there for AE firms. Big ones. The question is, are you in the mood to catch one?
If you have your sights set on making a significant strategic move, whether it’s creating a digital platform, making a game-changing acquisition, or shifting into an emerging market, you need to get in the right mood.
Moods are an important ingredient in effective learning. But they are often confused with emotions, which are largely situational responses to various stimuli. Take the New England Patriots, for example. While many of you may feel joy and happiness when they lose a game (which may become a more frequent occurrence based on my observations), I, on the other hand, experience emotions ranging from mad to sad, depending on the opponent. In either case, we laugh or cry. Then we move on. But as Hal Macomber points out in “Mastering Lean Leadership,” while moods can also be situational, they tend to linger. We can bring them into the situations with a predisposition about what it will be like. Have you ever brought a mood of boredom to a company meeting? While other people in the meeting might be interested and engaged, you may leave the meeting the exact same way you came into it.
Some moods are pervasive. “Glass-half-full” and “glass-half-empty” are good examples. People described as either seem to be perpetually in one or the other mood, regardless of the situation in which they find themselves.
Moods can find us and we choose our own moods. For any of you readers who have done some public speaking, you may fall into a mood of anxiety even though you’ve gone over the material ten times. On the other hand, others who have prepared similarly decide they are going to have a high level of confidence when they walk out on stage.
If you want to know what mood you are in, just listen to your “inner chatter”—that conversation that’s going on in your head, saying things like, “I’m going to finish too early,” and “I’m going to freeze during Q&A.” Think of that as giving into the mood. On the other hand, the person getting into a confident mood will say things like, “I’m going to nail this,” and “If I can’t answer a question or two, it’s ok because I’m going to give them a ton of value.” Two prepared people. Two entirely different outcomes.
You can see what moods other people are in, too, by looking for clues. You can’t listen to their inner monologue, but you can observe the kinds of conversations they are in. For example, when people try to learn something, you may hear statements like, “I’m not good at that kind of thing. I’m going to sit this one out.” But you might hear others say, “I wonder how long it would take me to figure that out,” and then observe the person giving it a go.
Moods are born from the past and are projected into the future. Sometimes the projection is grounded (we tried something in the past that didn’t work, and now we’re trying the same exact thing again and we’re going to get the same result). Other times the assessment is not grounded. The two situations are not at all similar. In any event, moods become pervasive when we are not conscious of whether our assessments about the future are grounded or ungrounded.
Be aware that moods are contagious. You can give others the moods you have and you can contract the moods of others. For example, if your team is famous for saying things like, “Let me play devil’s advocate here—if we try this, that, and the other, we know we’re going to fail,” it could easily become your mood, as well. You will learn faster and have a much better chance of catching your wave if you take responsibility for your moods as well as the moods of those on your team.
Concerns lurk in the background of all moods. And for that reason, the desire to look good or be right is pervasive in AE firms. But allowing yourself to be gripped by these things blocks experimentation and learning. You end up in a mood of “that’s the way things are done around here”—and that’s precisely how you miss a wave.
For help catching your next wave, call Mark Goodale at 508.254.3914 or send an email to [email protected].
50 in 50: Nevada
50 states in 50 weeks: U.S. states economic and infrastructure highlights.
Key Economic Indicators
GDP: $155.5 billion
GDP 5-year compounded annual growth rate (CAGR) (2017-2021): 1.6% (U.S: 1.6%)
GDP per capita: $50,798 (U.S.: $58,154)
Population: 3.1 million
Population 5-year CAGR (2017-2021): 1.4% (U.S.: 0.5%)
Unemployment: 5.0% (U.S.: 3.9%)
Economic health ranking: #13 out of 50
Fiscal health ranking: #21 out of 50
Overall tax climate ranking: #7 out of 50
Key Sectors and Metro Areas
Top five industry sectors by 2021 GDP:
Top three industry sectors by GDP 5-year CAGR (2017-2021):
Top three metro areas by GDP:
- Las Vegas-Henderson-Paradise
- Reno
- Carson City
Top three areas by population 5-year CAGR (2016-2020):
- Las Vegas-Henderson-Paradise
- Reno
- Carson City
Infrastructure Highlights
Infrastructure: ASCE Infrastructure Grade (2018): C
In Nevada, according to the ASCE, the infrastructure for dams, drinking water, and schools is considered mediocre or poor. Approximately $400 million in funds from the Infrastructure Investment and Jobs Act (IIJA) destined for water and wastewater infrastructure, will go into a state revolving loan fund for local governments. Additionally, Nevada is likely to benefit from the $8.3 billion provision for Western water infrastructure and drought resilience, as the state is projected to face more issues with high temperatures, droughts, and changes to snowpack. Since the last ASCE report card, despite having roads and bridges in relatively good condition, population growth has caused commute times to increase significantly. Over the next five years, Nevada will receive at least $4 billion from the IIJA, divided into the following categories of projects (additional funds may be deployed as federal grants get awarded to states):
Construction spending (Value of Construction Put in Place – CPiP):
- Private Nonresidential 2020 CPiP: $5.1 billion; -5.7% 5-year CAGR (2016-2020), below overall U.S. CAGR of 2.0%
- State & Local 2020 CPiP: $3.5 billion; 7.5% 5-year CAGR (2016-2020), above overall U.S. CAGR of 4.8%
AE Industry
ENR 500 firm headquarters (2022): None
M&A activity since 2018:
- 4 deals with buyers from Nevada
- 20 deals with sellers from Nevada
For customized market research, contact Rafael Barbosa at [email protected] or 972.266.4955. Connect with him on LinkedIn.


Subscribe to our Newsletters
Stay up-to-date in real-time.