Word on the street > Issue 120
Word on the Street: Issue 120
Weekly real-time market and industry intelligence from Morrissey Goodale firm leaders.

Eight Magic 8 Ball Questions for the Fall
As we head into the fall, we’re hearing a series of very similar questions from industry CEOs and investors. Here are some of the most frequent and the responses we get when we shake the MG Magic 8 Ball here in the office (which is not actually in an office, it’s virtual—well, digital really—and we don’t shake it, we use the app—but you get my drift).
1. When will I see the money? When will the IIJA funds start entering into the system in earnest? When will these dollars flow to the bottom lines of industry firms? It’s been 10 months since the bill passed, and while there’s been plenty of planning done at the state and municipal levels, most industry CEOs don’t expect to see a meaningful positive impact for their firms until “sometime in 2023.” Magic 8 Ball says, “Cannot Predict Now.”
2. And exactly how much gets wired to my account? What will be the measurable economic impact of the IIJA for the AE and environmental industry? By how much will we expand? 1%? 10%? Will that growth be a quick hit over 12 or 24 months? Or will it be a more gradual absorption by the industry over a decade? What does the post IIJA world look like for the industry? A quick recalibration to 2019 levels? Or a slower decline to some steady state? Investors would like to know. Magic 8 Ball says, “Reply Hazy, Try Again.”
3. Is there a recession coming? The “everything, all the time” mix of negative/concerning economic indicators would suggest there’s trouble ahead. Some CEOs don’t want to utter the “R” word. Others see one coming but not impacting them. Still others are pushing to recalibrate their market mix to scale back their exposure to residential and commercial development. For most, however, concerns about a possible recession are crowded out by current good times for the industry and the expectation that any negative impacts will be countered by IIJA funds. Magic 8 Ball says, “Signs Point to Yes.”
4. Will rising interest rates impact industry consolidation and valuations? Individual investors in employee-owned firms and smaller PE/FOs are the most impacted by rising interest rates. The first group will have less ability to finance investments in their firms—putting more internal ownership transitions in jeopardy. The second group are curtailing their investment activity as the financing they need for their investments becomes more expensive or unavailable entirely. So, more supply, less demand—the result is downward pressure on valuations—especially for smaller firms and underperformers. Magic 8 Ball says, “Most Likely.”
5. Where are all the people? Well, there is a good chance they are among the growing number of employees who are blowing up (in many cases, doubling) voluntary turnover rates around the country. While firms continue to hire, many have been experiencing a step-function increase in (good) folks voluntarily up-and-leaving for more money, or a workplace where they can be in person with co-workers (oftentimes, this is a move from a national firm to a smaller local or regional one), or a remote or semi-remote gig, or to be where they feel more love. Is this voluntary churn going to continue? Magic 8 Ball says, “You May Rely on It.”
6. Is dynamic pricing here to stay? In the before times, firms would look to adjust billing rates annually, often with a lot of handwringing and worry (What if our clients push back? What if they take offense and use another consultant?) and much benchmarking (“OK, let’s increase our billing rates, but NOT more than our competitors! Find out what their new rates are!). Those days are gone. In this wild inflationary environment, CEOs are asking their leadership teams how fast and how frequently (quarterly?) should billing rates be increased. Magic 8 Ball says, “It Is Decidedly So.”
7. Will saying “no” to work damage my reputation? The constant balancing of trying to keep current and future clients happy while not having nearly enough staff to do the work is taking its toll on CEOs. Sure, they worry about staff burnout (see #5 above), but they’re also losing sleep about their firm’s brand. Their dilemma is what to do when the client comes to them after being turned down or let down by a competitor. When they are already operating over capacity with no end in sight, do they take the work and stress their team out further, or do they refuse to take the project and live with the longer-term consequences? Magic 8 Ball says, “Without a Doubt.”
8. Will the labor market return to normal soon? CEOs are wrestling with questions related to the fast-rising cost of labor/cost of talent on multiple fronts. How can we afford higher-than-budgeted pay raises when we have multi-year contracts and can’t pass the increased cost on to our clients? How do we recruit new talent when we have to pay the new recruits more than we’re paying our current staff for the same position? Will labor costs decrease if/when the economy slows down? Magic 8 Ball says, “Very Doubtful.”
What are the questions on your mind as you head into the fall? Contact Mick at [email protected] or 508.380.1868.
Famous Quiet Quitters
According to a recent Gallup survey, at least half of today’s workforce is made of up of “quiet quitters.” But quiet quitting is nothing new. In the nearly 30 years I’ve been a business consultant to the AE industry, quiet quitting has been a top concern of industry leaders. Here’s a list of the questions they’ve asked me—some of them too many times to count:
- “How am I supposed to keep my people really engaged?”
- “Why won’t these young folks work hard like I did when I was their age?”
- “What can we do to preserve that family culture we’ve always had?”
- “What about another employee survey?”
- “Should we install a rock-climbing wall?”
To get a handle on how address questions like these, let’s take a look at some famous quiet quitters from the past and see how to best engage them:

GEORGE COSTANZA
The Challenge:
Jerry Seinfeld’s best friend, the famously insecure and remarkably lazy George Costanza, once built a hidden bed under the desk in his office at Yankee Stadium, creating a sort of secret siesta haven. After napping for a couple of hours, George would emerge refreshed and ready for his three-hour lunch break. He was also known to feign looking annoyed so his boss would think he was busy.
Suggested Approach:
You’ve got to make George’s work visible to everyone in his group. All of it. Implementing a Kanban board (Google the term) and having daily check-ins with George and his team each morning will clearly indicate which tasks are getting done, and which are stuck and why. As long as George is delivering on his daily promises, he can take as many naps as he likes. Otherwise, you’ll need to change George or change George out.

JIM HALPERT
A mild-mannered sales representative originally from the Scranton branch of paper distribution company, Dunder Mifflin, Jim Halpert sees his role as just a job. “If I advance any higher, this would be my career,” says Jim. “And if this were my career, I’d have to throw myself in front of a train.” Clearly, Jim is not engaged. He spends most of his time making time with the receptionist at the front desk and relentlessly pranking his nemesis, the arrogant and irascible Dwight Schrute, assistant to the regional manager. Jim once made Dwight hit himself in the head with his own phone by putting more and more nickels into Dwight’s handset until he got used to the weight—then one day, Jim took them all out.
Suggested Approach:
Jim’s got a spark and shows creativity. It just needs to be channeled toward something productive. Jim would thrive with a good coach (anyone other than Michael Scott). Take Jim out to lunch, share the upside you see in him, and implement the GROW coaching model (Google that, too). Challenge him, then get the heck out of the way.

PETER GIBBONS
A young computer programmer at Initech, Peter spends most of his day confined in a tight cubicle staring at his computer screen. His main responsibility is to update bank software for the Year 2000 switch. Peter explains his job this way: “You see, they wrote all this bank software and to save space, they put ‘98’ instead of ‘1998.’ So I go through these thousands of lines of code and, uh, it doesn’t really matter.” He says he doesn’t like his job, yet he’s not going to quit. He simply isn’t going to work anymore. When under the lingering effects of hypnosis, Peter divulged to the firm’s newly retained efficiency consultants that in a given week, “I only do about 15 minutes of actual, real work.” It’s not that he’s lazy. He just doesn’t care. He says it’s a problem of motivation. If he works his backside off and Initech ships a few more units, he doesn’t see another dime.
Suggested Approach:
First, pay people what they’re worth, then base a meaningful percentage of incentive compensation on firm-wide performance. And it sure would be good if he had an advocate—someone to watch out for his learning and growth. Oh yeah. One more thing. With lots of people working from home now, you might want to rethink the cubicle thing—I don’t know about you, but I don’t think people like them all that much.
For more ideas on how to address quiet quitting, call Mark Goodale at 508.254.3914 or send an email to [email protected].
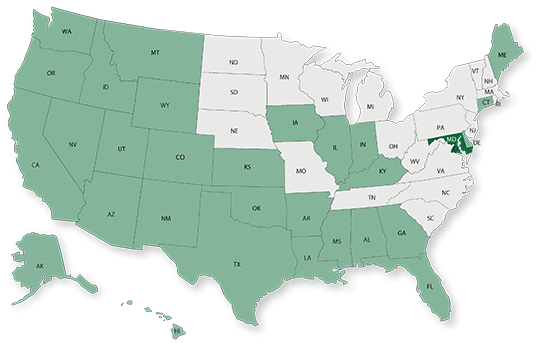
50 in 50: Maryland
50 states in 50 weeks: U.S. states economic and infrastructure highlights.
Key Economic Indicators
GDP: $364.2 billion
GDP 5-year compounded annual growth rate (CAGR) (2017-2021): -0.2% (U.S.: 1.6%)
GDP per capita: $59,616 (U.S.: $58,154)
Population: 6.2 million
Population 5-year CAGR (2017-2021): 0.6% (U.S.: 0.5%)
Unemployment: 4.3% (U.S.: 3.9%)
Economic outlook ranking: #37 out of 50
Fiscal health ranking: #37 out of 50
Overall tax climate ranking: #46 out of 50
Key Sectors and Metro Areas
Top five industry sectors by 2021 GDP:
Top three industry sectors by GDP 5-year CAGR (2017-2021):
Top three metro areas by GDP:
- Baltimore-Columbia-Towson
- Salisbury
- Hagerstown-Martinsburg
Top three metro areas by population percentage increase in 2021 vs. 2020:
- Salisbury
- Hagerstown-Martinsburg
- California-Lexington Park
Infrastructure Highlights
Infrastructure: ASCE Infrastructure Grade (2020): C
Systemic budget shortfalls and a continuing decline in ridership have contributed to poor transit infrastructure conditions in Maryland. Additionally, the latest White House update on the Bipartisan Infrastructure Law (BIL) indicated that the state has 273 bridges and over 2,201 miles of highways in less than mediocre condition. A total of $1.3 billion has been assigned to state transportation agencies this year, which will be used in combination with the state’s Consolidated Transportation Program (CTP) for improvement projects over the next six years. In September, Maryland received approval to access $23 million to install about 3,500 charging ports along its main interstate corridors.
As it relates to water infrastructure, the state can tap into the $144 million that was assigned from the federal government this year. In addition to lead pipe replacement and PFAS chemicals, projects will tackle improvements aimed at preventing situations like boil warnings due to E.coli contamination, which affected certain areas of Baltimore earlier this month. Over the next five years, Maryland’s BIL funds will address the following categories of projects (additional funds may be deployed as federal grants get awarded to states):
Construction spending (Value of Construction Put in Place – CPiP):
- Private Nonresidential 2021 CPiP: $4.1 billion; 3.8% 5-year CAGR (2017-2021), above overall U.S. CAGR of 1.4%
- State & Local 2021 CPiP: $5.0 billion; -2.2% 5-year CAGR (2017-2021), below overall U.S. CAGR of 4.0%
AE Industry
ENR 500 firm headquarters (2022): 9
M&A activity since 2018:
- 56 deals with buyers from Maryland
- 39 deals with sellers from Maryland
For customized market research, contact Rafael Barbosa at [email protected] or 972.266.4955. Connect with him on LinkedIn.
Weekly M&A Round Up
Industry M&A is up 22% over the past 12 months. Last week we reported a total of seven domestic transactions with consolidation taking place in Colorado, Arizona, North Carolina, Tennessee, Illinois, Georgia, and Texas. You can check all the week’s M&A news here.
If you’d like to know more about our M&A services, and how we can help you either confidentially sell your firm or grow through acquisition then please contact Nick Belitz, Principal, at [email protected] or 303.656.6151.
June 12-14, 2024 Las Vegas, NV
Western States M&A and Business Symposium
Join us for the 10th annual Western States Symposium, bringing together over 200 AE and environmental industry executives and investors in one of the world’s most vibrant and iconic cities.
Learn More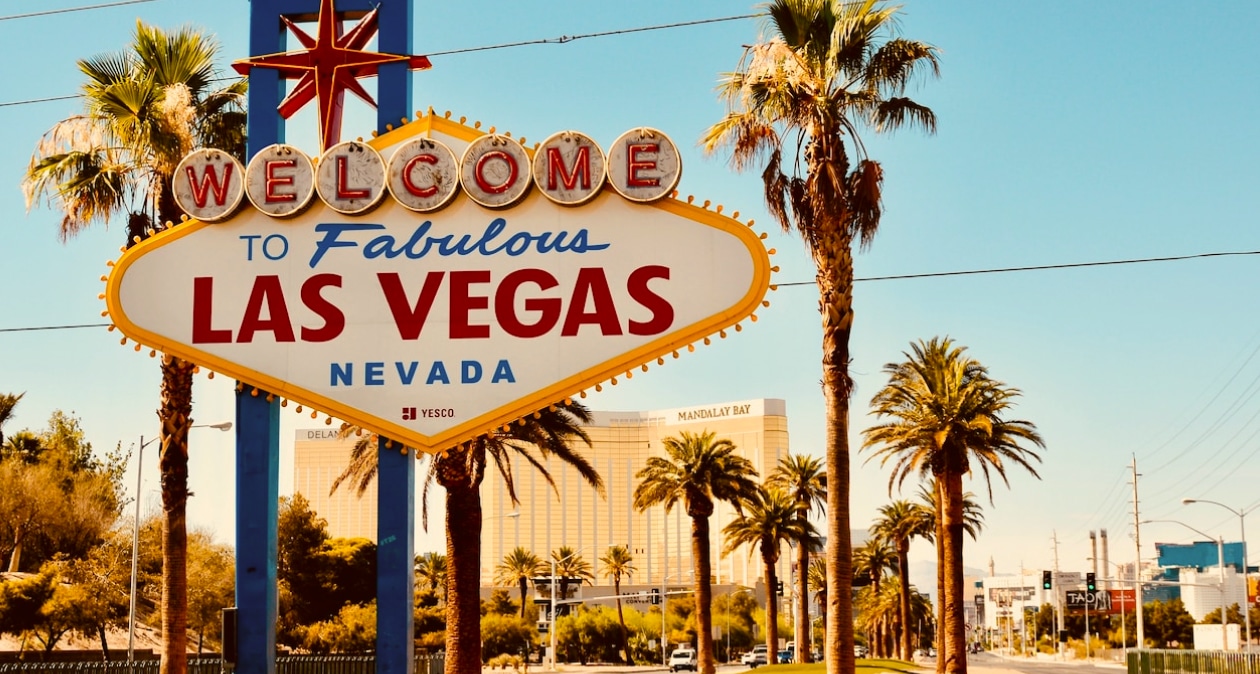


Subscribe to our Newsletters
Stay up-to-date in real-time.