Word on the street > Issue 118
Word on the Street: Issue 118
Weekly real-time market and industry intelligence from Morrissey Goodale firm leaders.

The Summer’s End
As I was wistfully putting away my white bell-bottoms for the season—as one is forced to do after Labor Day (why fashion police, why?)—and listening to Phoebe Bridgers’ “Summer’s End,” I discovered in one of the back pockets some notes from my conversations with industry executives and investors from this summer. And here they are in no particular order:
Gimme a break: More than a handful of CEOs mentioned that while their backlogs were at record levels and sales were strong, their top- and bottom-line performance in June and July was noticeably softer than forecasted. What they were finding was that in this first “normal” summer in two years—and having worked harder in the past 24 months than ever before—many employees were just choosing to work less and instead enjoy the summer. And managers were fine with this because they too had been overloaded for far too long. The big shocker was there wasn’t much if any pushback from clients on this dynamic. Turns out the clients also needed a break. This is how these firms were dealing with employee burnout. Collectively everyone appeared to be saying, “Gimme a break. I deserve it, and you know I do. And all of this work will be here when the summer is gone.” It was like a collective “I got your back if you’ve got mine, now let’s go hit the beach, no harm no foul, and I’ll see you back here in September.”
Dog catches car: A ton of smaller firms have invested remarkable amounts of time, treasure, and talent to develop software products. Most of these are market-facing, but more than a few are designed to improve internal operations and knowledge management. However, it would appear the majority of these firms do not know how to capitalize on those investments. And they didn’t come to that realization until way too late in the development cycle. Thus, many are left with a sunk investment in an atrophying software product gathering dust on the proverbial shelf. What starts out as a dopamine hit of excitement oftentimes turns into a messy divorce between the individual who originally championed the software product and the firm. Nobody wins. Pro tip: If you’re going to develop software or tech in your design or environmental firm, get advice early from a tech exec or consultant who knows the business ins and outs of software development and marketing/sales. Get out of your bubble.
Creeping client concentration: Demand for AE services has been overwhelming supply for the past decade with a step function increase during the pandemic. On average, backlogs around the country today stand at over a year’s worth of work. Which is a good thing, right? Yes, but. It would appear that—especially since the pandemic—backlogs are showing creeping client concentration. Not surprising, really. Bigger project owners have relatively more capital to throw around and tend to “crowd out” smaller competitors to push their way to the front of the line to sign up the best designers. And even though designers have been saying “no” to new work more frequently over the past two years, they never, ever refuse more work from an existing good client. And so, as backlogs have grown to record levels, client concentration has also increased. Which is all fine and good in the short term. But as we all know, when your biggest client calls to say that they are stopping work (and they always do), it’s never a good day at the office.
Just me, myself, and I: I’ve been struck with how many CEOs now set aside “quiet days” for themselves to work and reflect. No calls, no emails. Just the work and thinking that they need to do to formulate and make progress on corporate initiatives. It’s typically just one day a week and is a result largely of the hybrid model where CEOs find themselves working from home on a Friday. There’s a boatload of research that suggests that designers and software developers perform better with two “meeting-free” days per week. Meetings don’t just consume the scheduled time but also the set-up and take-down times before and after. It would appear that a growing number of chief executives are also benefiting from the solitary time and space to do their work. (Or else it’s just a big smokescreen on their part, and they’re goofing off like everyone else on Fridays in the summer.)
What if? On the topic of work from home: First, that’s a misnomer. Probably better to frame it as “work not from your employer’s leased or owned location.” The industry is still all over the map on hybrid work. My meetings with clients in the central business districts (CBDs) of Dallas, Fort Worth, New York, San Francisco, Boston, Montreal, and Chicago this summer mostly took place in eerily vacant offices of thriving firms having their best-ever years. I guess a lot of the “thriving” was taking place outside of the office. Conversely, conversations with clients in non-CBDs reaffirmed that in most cases most folks were working from the office—and happily so. The number “80%” kept coming up in my discussions with CEOs this summer about how many folks were working in the office vs. from somewhere else, which would suggest an industry that’s kinda like what it was pre-pandemic in terms of how work is getting done. My question is: What if your next president is one of the 20%? What if she wants to work remotely? What will that mean for your firm? Will next-generation leaders who are adamant about working remotely be precluded from being CEOs?
Not gonna play that game: I play golf weekly with three excellent AE professionals whose consistently high performance in their respective businesses is matched only by their remarkable inconsistency on the golf course. When not fishing for lost balls in water hazards, we sometimes talk business. Their experience with rising construction and labor costs for their businesses reflect what’s transpiring across the industry in 2022. Rising construction costs are forcing project owners into knee-jerk value engineering decisions. Meanwhile, across the industry, leadership teams are facing the harsh reality that all of their investments in culture and values is no match for the mighty dollar. In today’s labor market, cold hard cash—in salary and signing bonuses—count more than ever before.
How was your summer? Contact Mick at [email protected] or 508.380.1868.
Strategic Thinking (Part 2—Porter’s “5s”)
In the last issue of Word on the Street, we talked about getting our heads around strategic thinking. Most of the decisions architects and engineers make tend to deal with their particular areas of expertise, but that kind of thinking doesn’t take care of the concerns of the firm—namely:
- Sustainability: The sustainable use of a firm’s resources (be they human or capital)
- Serviceability: Consistently producing significant value and a superb experience for a firm’s clients
- Survivability: Making enough money to pay for today and invest in tomorrow
Taking care of those issues requires strategic thinking. We drew the line between tactical and strategic thinking, gave examples, and discussed the importance of distinguishing between the two. This week, we’ll cover the five definitions of strategy and the five forces of competition, both of which set the table for strategy development.
Those of you who took a business class or two in college might remember Michael Porter. Porter is an academic, well-known for his theories on economics, business strategy, and social causes. He is credited with developing the “Five Forces” model, which is widely used in various industries to help develop strategy. His work applies nicely to the AE industry, starting with his five definitions of “strategy.”
THE FIVE “P’s”
The word “strategic” modifies many other words and actions to give them a sense of importance.
We hear about a “strategic move” or a major “strategic undertaking”. But quite often, the debate on what to do and how it is done occurs because of the different meanings attributed to strategy. Porter provides the following five definitions of strategy (the 5 “P’s”), as follows:
Definition #1: Strategy as a Plan
- A consciously intended course of action.
- It could take the form of a set of guidelines or a written report that leaders and managers use to guide their decisions.
- Some organizations go through a formal process and arrive at a document that will guide their actions for years to come.
- As a plan, strategy provides information about what was intended.
Definition #2: Strategy as a Pattern
- An after-the-fact view of strategy.
- When you observe an organization over time, patterns are seen in streams of action.
- You may see a consistency that suggests a direction.
- When that pattern, which is a “realized” strategy, was not originally intended, it is called “emergent”.
- As a pattern, strategy looks at actions and behaviors, where intentions may have to adjust to a changing environment.
Definition #3: Strategy as a Position
- Leaders see their firms as occupying a space within an environment.
- That space is often defined in terms of market share.
- AE firms serve markets, which are groups of service buyers with common wants and needs (e.g., higher ed, healthcare, commercial/retail, infrastructure-related agencies, Federal government, etc.), and there can be further segmentation within those market sectors (Federal government/military, etc.).
- Firms set revenue and profit targets for services provided to those markets.
- As a position, the focus is on the competitive environment and how firms attempt to achieve competitive advantages.
Definition #4: Strategy as a Perspective
- Perspective is how a firm sees itself and expresses a way of doing things.
- It is the organization’s way of perceiving the world.
- In many AE firms, it’s about connectedness and relationships—with both internal and external project/client teams.
- As a perspective, strategy looks at how people share values and collaborate to produce the work of a firm.
Definition #5: Strategy as a Ploy
- A short-term maneuver intended to outwit or preempt competitive strategic moves.
- Recruiting key leaders out of a regional firm ahead of a national competitor’s acquisition of that same firm.
Tying the 5 “P’s” Together
These multiple definitions enable us to view strategy not only from the important competitive perspective but also to better understand how people in a firm help to shape the process. In some ways the definitions may be interchangeable, but they also complement each other– thus, they are not mutually exclusive.
As a diagnostics tool, if you find contradictions in the different P’s when applied to your own organization, it may signal confusion regarding your firm’s sense of direction and how it is trying to achieve its goals.
FORCES AFFECTING COMPETITIVE STRATEGY
An industry is defined as the group of competitors that produce similar services that satisfy the same, basic client need, and leaders must understand the nature of competition within their industry so they can identify opportunities and threats facing their companies. The AE industry is no exception. From this analysis, AE firm leaders judge the potential in the industry for above-median profitability and ultimately determine the best strategy for their firms to pursue to either offset or leverage competitive forces. The model for analyzing an industry, including the AE industry, consists of five forces of competition:
Force #1: Industry Competition
When companies in the AE industry compete, they often use tactics such as price competition, marketing campaigns, and political contributions. The intensity of the competition depends on factors such as:
- Number of competitors
- Rate of industry growth
- Life cycle stage of the industry
- Available pool of expertise
- Diversity of rivals
Force #2: New Entrants
New entrants or companies that are not currently part of the competitive group may be looking for an opportunity to enter the industry—does PE ring a bell? How much of a threat they pose depends on the barriers to entry present and the reaction from existing competitors. Barriers to entry include economies of scale, service differentiation, capital requirements, political landscape, and specialized expertise.
Force #3: Bargaining Power of Clients
Clients affect an industry by being able to force down prices, bargain for more services, or play competitors off of one another. Given the AE industry is a mature one, commoditization is often a threat to industry firms. Buyers of AE services are generally price-sensitive and demand market-specific expertise. Hence, it is in those two areas where AE industry rivals tend to compete most.
Force #4: Bargaining Power of Vendors
Vendors can apply pressure to industry firms by raising their prices, lowering their quality, or reducing the availability of their products. The bargaining power of vendors affects the competitive environment and profit potential of industry firms.
Force #5: Threat of Substitute Services
Substitute services are those provided by competitors in a different industry but come close to satisfying the same consumer need. The threat of substitutes exists because their existence places a ceiling on prices the industry can charge, and further commoditize what the industry produces. When prices get too high, clients will switch to the substitute, unless the industry upgrades or differentiates its services, thus making the substitute less appealing.
Tying the 5 Forces Together
In scanning the AE industry, firm leaders assess each force as high, medium, or low in terms of its strength, and judges the potential for above-normal profitability. While a high force is a threat because it is likely to reduce profits, a low force is an opportunity because it may allow the company to increase market share, raise prices, and earn higher profits. Thus, studying each force points leaders to actions it can take to influence the effect of the industry’s forces on the company.
Next week, we’ll cover the various facets of developing strategy. In the meantime, for more information on strategic planning, call Mark Goodale at 508.254.3914 or send an email to [email protected].
50 in 50: Texas
50 states in 50 weeks: U.S. states economic and infrastructure highlights.
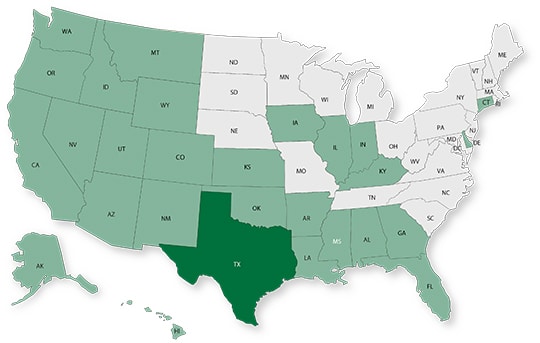
The Texas and Southern States M&A, Strategy and Innovation Symposium is less than a month away! This week in our series, we feature the Lone Star State.
Texas, the 9th largest economy in the world, is by far the largest of the contiguous states and has a plenty of room to grow from an infrastructure perspective. The state ranks high in terms of economic diversity, despite being responsible for over 10 percent of the country’s oil production. Many technology, manufacturing, and of course, AEC firms have moved into Texas to take part in its business-friendly and lightly regulated environment. The state has 11 metro areas among the top 100 in the country in terms of population increase from 2020 to 2021. The more than 268 thousand square miles of Texas territory and recent government funding announcements make it the land of opportunity.
Key Economic Indicators
GDP: $1.8 trillion
GDP 5-year compounded annual growth rate (CAGR) (2017-2021): 2.4% (U.S.: 1.6%)
GDP per capita: $63,728 (U.S.: $58,154)
Population: 29.5 million
Population 5-year CAGR (2017-2021): 1.1% (U.S.: 0.5%)
Unemployment: 4.0% (U.S.: 3.9%)
Economic outlook ranking: #11 out of 50
Fiscal health ranking: #33 out 50
Overall tax climate ranking: #14 out of 50
Key Sectors and Metro Areas
Top five industry sectors by 2021 GDP:
Top three industry sectors by GDP 5-year CAGR (2017-2021):
Top three metro areas by GDP:
- Dallas-Fort Worth-Arlington
- Houston-The Woodlands-Sugar Land
- Austin-Round Rock-Georgetown
Top three metro areas by population percentage increase in 2021 vs. 2020:
- Sherman-Denison
- Austin-Round Rock-Georgetown
- Killeen-Temple
Infrastructure Highlights
Infrastructure: ASCE Infrastructure Grade (2021): C
In Texas, highways and roads, levees, dams, and wastewater infrastructure received the lowest grades based on last year’s ASCE report. The organization estimates a funding gap of about $50 billion in water and wastewater infrastructure over the next 20 years. Weeks ago, TxDOT announced the advancement of the Unified Transportation Program (UTP), a 10-year plan that provides $85 billion in funding towards transportation safety, congestion, and rural connectivity. Texas handles more cargo and has more rail miles than any other state. Being a large state not only requires heavy investments but also forces engineers involved in projects to maximize efficiencies in order to lower operational and maintenance costs for transportation and other infrastructure systems. The state will receive over $35 billion from the Bipartisan Infrastructure Law (BIL), which will help sustain its economic growth. Over the next five years, Texas’ BIL funds will address the following categories of projects (additional funds may be deployed as grants get awarded to states):
Construction spending (Value of Construction Put in Place – CPiP):
- Private Nonresidential 2021 CPiP: $50.9 billion; 2.6% 5-year CAGR (2017-2021), above overall U.S. CAGR of 1.4%
- State & Local 2021 CPiP: $39.9 billion; 6.0% 5-year CAGR (2017-2021), above overall U.S. CAGR of 4.0%
AE Industry
ENR 500 firm headquarters (2022): 42
M&A activity since 2018:
- 186 deals with buyers from Texas
- 186 deals with sellers from Texas
For customized market research, contact Rafael Barbosa at [email protected] or 972.266.4955. Connect with him on LinkedIn.
Weekly M&A Round Up
Industry M&A is up 21% over the past 12 months. Last week saw new domestic transactions announced in TX, LA, NJ, MA, CO, WA, and NY including five of which involve private equity. You can check all the week’s M&A news here.
If you’d like to know more about our M&A services, and how we can help you either confidentially sell your firm or grow through acquisition then please contact Nick Belitz, Principal, at [email protected] or 303.656.6151.
June 12-14, 2024 Las Vegas, NV
Western States M&A and Business Symposium
Join us for the 10th annual Western States Symposium, bringing together over 200 AE and environmental industry executives and investors in one of the world’s most vibrant and iconic cities.
Learn More


Subscribe to our Newsletters
Stay up-to-date in real-time.