Word on the street > Issue 110
Word on the Street: Issue 110
Weekly real-time market and industry intelligence from Morrissey Goodale firm leaders.

The Questions Raised By The Gloriously Heterogeneous AE Industry Of 2022
Before March 2020, the way work got done in the AE industry was stunningly homogeneous. It didn’t matter if your firm was headquartered in Alaska or Alabama. Or if you were the iconic AECOM or a no-name ABC. Or if you were a PE or an AICP. Every firm operated pretty much the exact same way. Surveying, field collection, and construction services took place outdoors. Everything else—planning, design, detailing, analysis, QA/QC, research, and all of the meetings associated with these activities—happened in an office.
And the relationships between the employees in those offices—and those between office folks and field folks—followed well-defined, recurring, and predictable patterns. These patterns provided the basis for the short-term (operations, quality, client-service) and longer-term (transition, culture, values) foundational elements of every firm. And, given the homogeneous nature of the industry, these patterns provided a common language for leaders, managers, and employees to use when they chose to collaborate or compete with other firms or recruit talent from—or indeed move on to—other firms. We all pretty much worked the same way, regardless of where we were or what part of the industry we occupied. The biggest difference was what got served at lunch-and-learns (some cities have better bar-b-que than others, some have better pizza, and some serve up delicious quinoa).
Today, that’s all changed. Homogeneousness is out. In 2022, how work gets done, how teams interact, and how decisions get made are dramatically different depending on where a firm is located.
- Back to the office? Not likely: The Kastle Back to Work Barometer (Figure 1) tracks office occupancy in the nation’s top 10 cities.
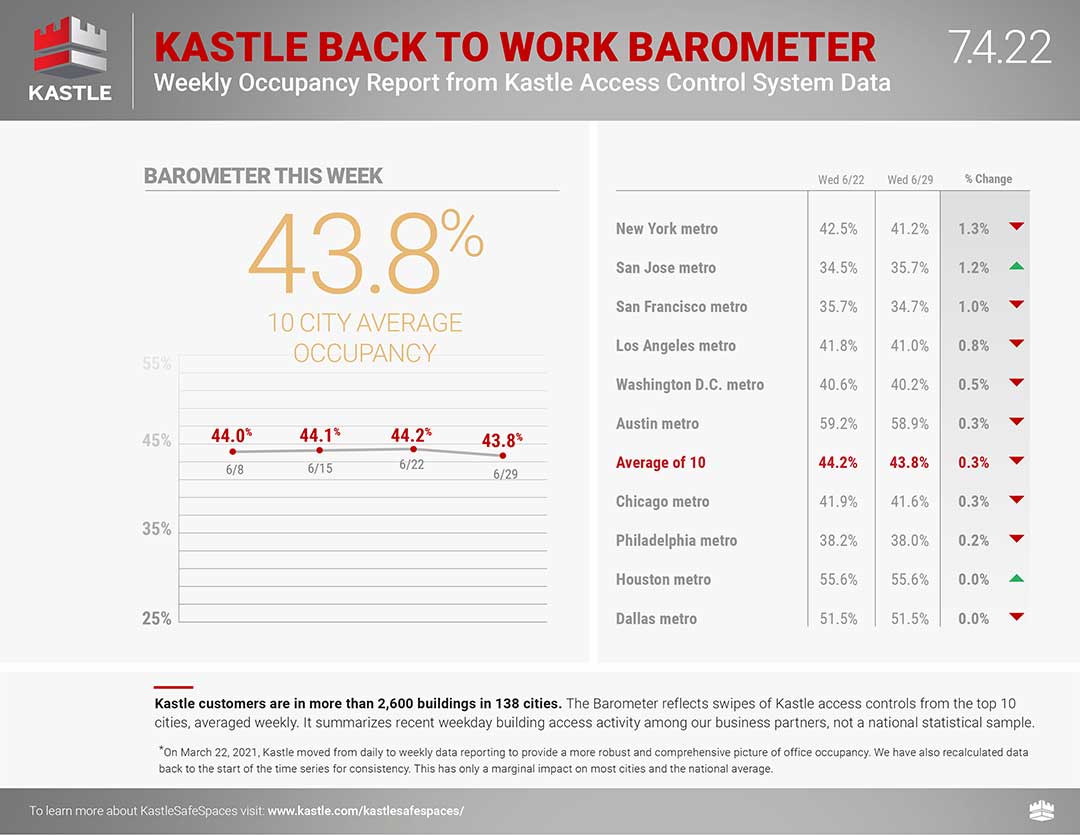 On a weekly basis, it compares current and pre-pandemic occupancy rates. The headline is that average office occupancy in the country’s top 10 cities is still less than 44% of where it was in 2019. The related message is that while people have been reluctant to return to the office, they have eagerly embraced their pre-pandemic recreational habits. (Figure 2)
 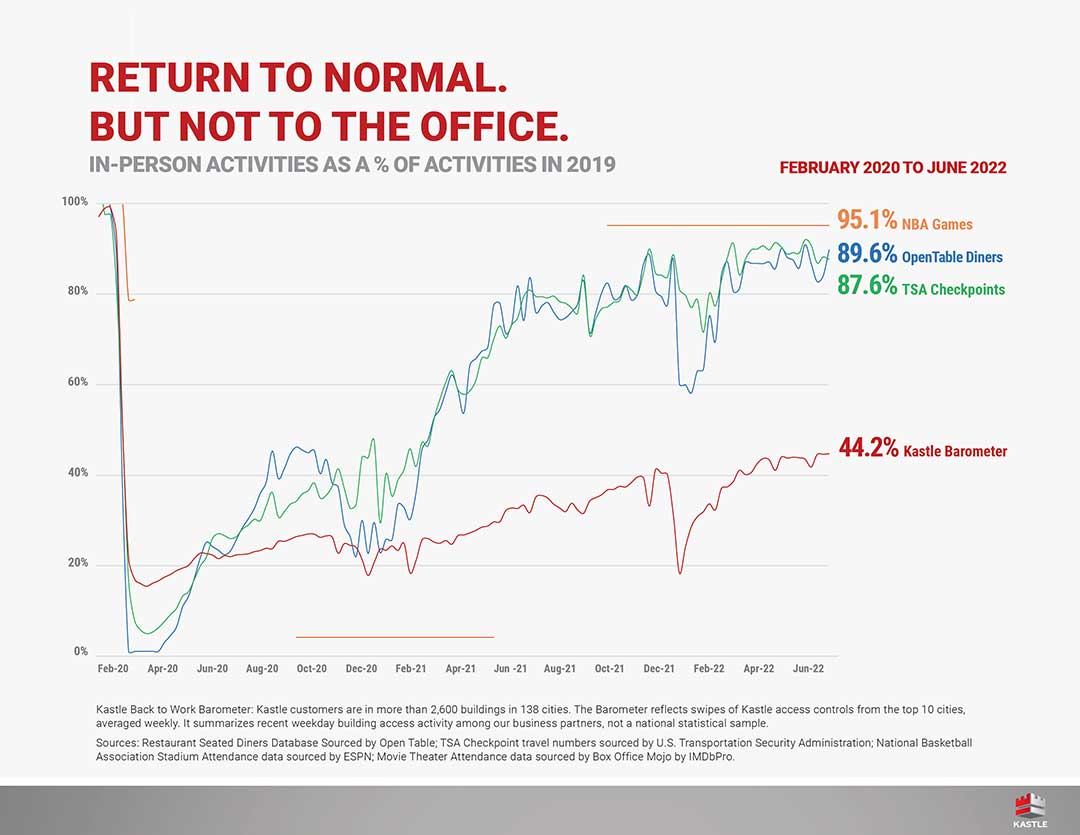 This same dynamic is at play in AE firms with offices in major metros. Compared with pre-pandemic days, less work is being done in AE industry offices in major metros, while more is being done remotely. In these same major metros, employees are spending less time together physically when compared with pre-pandemic days, and they are building relationships differently than before. We see this in our strategy work time after time when we visit clients in big cities. Plenty of space to spread out. Unoccupied cubicles and offices. Younger and newer employees seeking out the social and learning benefits of the in-office experience, while older (typically married with children) managers are choosing to work remotely or minimize their time in the office. A big generational gap. The Kastle Back to Work Barometer has yet to climb above 50% since March 2020 and has been stuck around the mid-40% range for all of 2022. Will office occupancy return to pre-pandemic levels in major cities? And if so, when? (Maybe a more relevant question for older AE professionals with longer commutes would be “Why”?)
 - City to City: Yes, sure it’s the name of the awesome 1978 Gerry Rafferty album that delivered the greatest opening sax solo of all time on “Baker Street.” But move beyond the general trend of lower office occupancy in cities in general, and it’s in the city-by-city data you find how the AE industry is fragmenting in 2022. Cities in the South—Houston, Austin, Dallas—all have occupancy rates higher than 50% per Kastle. We see this in our consulting work with clients in these cities as well as others in the South such as Miami, Tampa, and Phoenix. However, cities in the Northeast and Mid-Atlantic (New York, Philadelphia, Washington, DC), Midwest (Chicago), and West Coast (San Jose, San Francisco, Los Angeles) have measurably lower office occupancy rates—as low as 35%. We see this dynamic at play with clients in similar cities such as Seattle, Portland, Boston, Minneapolis-St. Paul, and Baltimore. Eerily empty downtowns, devoid of the social activities that were present per-pandemic, where employees are reluctant to commute to. Painted in broad brush strokes, AE industry employees in cities in the South are in their offices more frequently—and are present with each other more regularly—than their peers in cities in other parts of the country. They are spending more time together—and with clients—than their peers in the Northeast, Midwest, and West Coast. Given that a majority of the ENR Top 500 firms are headquartered in major metro areas, what does this disparity in how work is getting done in different cities mean for the industry’s largest design and environmental firms? Could this mean that firms in the South are developing stronger and more meaningful relationships with co-workers and customers that will provide immediate or longer-term competitive advantages? What are the implications for firms that are headquartered in Southern cities? Will they have stronger cultures than their peers headquartered in non-Southern cities? Will they have a higher probability of transitioning leadership and ownership by virtue of choosing to spend more time with each other?
- Beyond the city: In our strategy, M&A, firm transition, and executive search work around the country, we’ve found one thing to be consistent. By and large, firms that are headquartered in—and have offices in—rural areas, smaller municipalities, and smaller cities are close to 100% in the office. In fact, they’ve maintained that posture before, through, and since the pandemic. And for the most part, this is an employee-driven “we want to be in the office” dynamic rather than a management directive. Sure, most of these firms are providing flexible/hybrid working options for employees who require or prefer flexibility. But for the most part, these offices are—regardless of region—consistently close to full and vibrant. These firms have experienced little of the cultural or operational dislocation that is more prevalent among their larger industry peers or those firms with operations in larger cities. For the most part, their organizational and cultural development has followed a more traditional and predictable path over the past 36 months—one in which human contact and physical presence is at the center of all activities.
- Your reality is not mine: In January 2020, if you ran an architecture firm based in San Francisco with offices on the West Coast, the operational, human capital, and marketing elements of your strategic plan were almost an exact facsimile of a similar-sized architecture firm headquartered in Dallas with offices on the Gulf Coast. That’s not the case in 2022. In January 2020, if you were a new employee or intern at a high-profile structural firm, your daily routine and opportunities to access in-person learning and development through managers and peers were almost the exact same regardless of whether your firm was in New York City or Miami. Today, that’s not the case. In January 2020, if you were the CEO of a firm, you could fully expect that your project managers would willingly and eagerly visit with clients to develop business, regardless of whether you were headquartered in Portland, Oregon, or Portland, Maine. Today, that’s not a given. How the AE industry is working now is not only different than how it did pre-pandemic, it’s also working very, very differently depending on where the work is being done in the country.
- The upshot—more questions than answers: This relatively rapid transition from a homogeneous working model to a creatively heterogenous one raises a ton of questions for the industry. Do firms with more employees in the office for a greater amount of time perform better in the short term? What about the longer term? What are the implications for firm sustainability and transition? What about knowledge transfer? What about relative strengths and weaknesses in terms of hiring and retaining employees of different generations? Why are firms in the South and in rural areas seeing higher occupancy rates? Does this translate into greater engagement, collaboration, innovation?
Thoughts, insights? How is work getting done in your firm today as compared to the past? To connect with Mick Morrissey, email him at [email protected] or text/call at 508.380.1868.
The Implications Of Fear And Trust
During this time of upheaval, fear and trust are producing dramatically different effects in firms throughout the AE industry. In fact, they appear to bring out the very best and worst in leadership teams, especially when the heat is on. And the last few years, the heat has definitely been on. Those leadership teams that are built on trust will find themselves well-prepared to deal with the next big disrupter while those driven by fear are in a precarious position—whether they realize it or not.
A couple of leadership teams I have observed in the last few months are dominated by leaders who are either driven by fear, drive fear through others, or both. In good times, it can be a tolerable situation for those on the receiving end. Strong financial performance has a way of covering up problems. But even then, top performers who are not appreciated or respected will always have one foot out the door. If the firm is not performing, the results produced by a dysfunctional leadership team can wreak havoc throughout an otherwise healthy organization. Whether it’s demanding unrealistic results, ignoring good advice because it didn’t come from them, or simply being unable to trust anyone—which in turn makes them untrustworthy, leaders who allow themselves to be ruled, and/or rule, by fear can do irreparable damage to their firms and themselves.
On the other hand, leadership teams that are able to cope in any kind of weather seem to have one thing in common—relationships that are built on a strong foundation of trust. Team members are willing to listen to each other, accept opinions other than their own, and build on ideas together. They believe the words and intentions of their partners are motivated by good intentions, even when initial comments or actions might seem objectionable. They understand the difference between an assessment and an assertion, and they don’t try to make a case for why someone’s opinion is “wrong.” Instead of assuming negative intent, which they know will make them angry and defensive, they focus on listening without filters, focusing on fully understanding what is being said rather than agreeing or disagreeing with it. They don’t waste time and energy on misattributing comments or behaviors by dreaming up less-than-flattering stories in their heads. Instead, they talk it through until they fully comprehend what’s really driving the “situation”—and whether there actually even is a “situation.” While there may be stress from time to time within these teams, each member shows a genuine, mutual respect for their partners. They rarely go long periods without communicating with one another and they don’t hold grudges. Leadership teams that have this foundation of trust hit issues head on and move quickly and eagerly to the next challenge. They realize that pointing their weapons at problems rather than each another ultimately propels their firms to greater success.
If your leadership team is fraying at the edges, pull them together, say what needs to be said, encourage others to do the same, then work through the issues. It’s neither an easy thing or a hard thing to do—instead, you’re either practiced at it or you’re not. If you don’t want to go that route, however, at least ask yourself why that is until you get to the root cause. Is it because you just want to keep the peace? Is it because you are too close to your partners and you think you can’t confront them on their performance? (Leaders often fear that their partners will leave the firm if confronted about poor performance, resulting in potentially damaging short-term consequences.) Is it because you can’t get past some slight you think was aimed at you? Or is it that you have no need for their input in the first place? (In this case, why are they or you still in the firm?) If you really want to build trust, try sharing one of those root concerns with your leadership team. Showing that kind of vulnerability, sincerity, and courage will garner the respect of those partners worth their salt, and they, in turn, will open up to you.
What kind of leader are you? What kind do you want to be? Maybe it’s time to trade in fear for trust.
If you’d like help building a healthy organization, call Mark Goodale at 508.254.3914 or send an email to [email protected].
50 in 50: Illinois
50 states in 50 weeks: U.S. states economic and infrastructure highlights.
Key Economic Indicators
GDP: $774.6 billion
GDP 5-year compounded annual growth rate (CAGR) (2017-2021): 0.6% (U.S: 1.6%)
GDP per capita: $61,946 (U.S.: $58,154)
Population: 12.7 million
Population 5-year CAGR (2017-2021): -0.2% (U.S.: 0.5%)
Unemployment: 4.6% (U.S.: 3.9%)
Economic outlook ranking: #45 out of 50
Fiscal health ranking: #48 out of 50
Overall tax climate ranking: #36 out of 50
Key Sectors and Metro Areas
Top five industry sectors by 2021 GDP:
Top three industry sectors by GDP 5-year CAGR (2017-2021):
Top three metro areas by GDP:
- Chicago-Naperville-Elgin
- Peoria
- Rockford
Top three metro areas by population 5-year CAGR (2016-2020):
- Champaign-Urbana
- Bloomington
- Chicago-Naperville-Elgin
Infrastructure Highlights
Infrastructure: ASCE Infrastructure Grade (2022): C-
In Illinois, according to the ASCE, the infrastructure for roads, transit, drinking water, stormwater, and inland waterways is considered mediocre or poor. Of those, drinking water is the only category that received a lower grade compared to the 2018 report card.
Investments of nearly $150 million in ports helped improve the inland waterways grade. Meanwhile, the drinking water category got worse as more groundwater supply systems are in violation of EPA regulations and issues with leaking pipes and water main breaks have increased in recent years.
This May, over $120 million in new infrastructure grants were awarded to 34 localities across Illinois for roads, bridges, and water treatment upgrade projects as part of the Rebuild Illinois Public Infrastructure (RIPI) Capital Program. The initiative is expected to provide over $3 billion to support critical infrastructure in the state in the next four to five years. Over a similar time period, Illinois will receive nearly $18 billion from the Bipartisan Infrastructure Law divided into the following categories of projects (additional program funds with competitive grants may be deployed):
Construction spending (Value of Construction Put in Place – CPiP):
- Private Nonresidential 2020 CPiP: $8.4 billion; -3.6% 5-year CAGR (2016-2020), below overall U.S. CAGR of 2.0%
- State & Local 2020 CPiP: $11.6 billion; 4.0% 5-year CAGR (2016-2020), below overall U.S. CAGR of 4.8%
AE Industry
ENR 500 firm headquarters (2022): 28
M&A activity since 2018:
- 98 deals with buyers from Illinois
- 49 deals with sellers from Illinois
For customized market research, contact Rafael Barbosa at [email protected] or 972.266.4955. Connect with him on LinkedIn.
Weekly M&A Round Up
Industry M&A is up 27% over the past 12 months: Last week saw new transactions announced in FL, NY, UT, AZ, NV, IN, and CA, while U.S. M&A surpassed 260 deals this year. You can check all the week’s M&A news here.
If you’d like to know more about our M&A services, and how we can help you either confidentially sell your firm or grow through acquisition then please contact Nick Belitz, Principal, at [email protected] or 303.656.6151. Click here to see the over 150 transactions of design and environmental firms that we have helped make happen.


Subscribe to our Newsletters
Stay up-to-date in real-time.