Word on the street > AE Industry Intelligence: Issue 68
AE Industry Intelligence: Issue 68

A record-breaking six months of industry consolidation (Olympics edition)
The talent shortage can’t stop it. It’s oblivious to supply chain breakdowns. It shrugs off rising inflation. Nothing it seems can alter the pace or scale of the massive consolidation sweeping the A/E industry. Everywhere you look, another design or environmental firm has sold or merged or been recapitalized. Here’s a sampling of the jaw-dropping M&A stats and trends we saw at play in the first half of this year.
Breaking speed records like Sydney McLaughlin: With 203 transactions announced in the first half of the year, it was the most active six months of industry consolidation ever. We’re at a point now where every day at least one A/E or environmental firm sells or merges. The pace of industry consolidation has doubled since 2017. Over 40% of all industry consolidation in the last decade has taken place since 2018. (2018 ushered in a step function in deal activity.) Historically, industry consolidation increases in the second half of the year, so we are well on our way to seeing the industry’s first 400-plus deal year. This all begs the following questions: When will the supply of quality sellers be exhausted? When will the appetites of buyers be satiated?
California Stars: For the past three years, Texas has seen more deals than any other state. Not so in 2021. With 34 announced transactions, California led the U.S. in terms of consolidation in the first half of the year. The Golden State accounted for almost 17% of all transactions during the first six months of the year. Texas saw the second most consolidation with 19 deals. Florida dealmaking slowed in Q2, with only three announced transactions, for a total of 15 for the first half of the year.
All systems are grow! Geographic growth that is. Acquisition activity taking place across state lines hit an all-time high in the first half of the year. Nearly 69% (almost 7/10!) of all transactions involved a buyer headquartered in one state entering—or growing its existing business in—another state via acquisition. This is the highest level of cross-border activity on record. The industry is expanding in response to robust nationwide demand for A/E and environmental services, buyers feeling confident about the future, and a seemingly endless supply of acquisition capital available for deployment. (Pro tip for sellers: this stat means that your future buyer is likely from out-of-state and not in your network, so you probably have not met them physically or on Teams before.)
Size matters: After a steady—though slow—decline over the past three years, the median seller size in the first half of the year stabilized at $3.1 million in revenues. The median buyer size ticked up to $93.3 million.
The migration from employee ownership continues to something more like investor- or manager-owned. Over one-third of all transactions in the first half of the year involved recapitalization by a financial sponsor (either a private equity fund or a family office) or an acquisition by a firm backed by one or the other. Private capital’s remake in the industry continues unabated. It’s now the capital model for 14% of the ENR Top 100 Design Firms. And it’s not just for larger design or environmental firms. We are seeing a growing trend of smaller ($20 million or less) firms being recapitalized by financial sponsors.
Headline grabbers: In any given year, we expect to see 10 of the ENR Top 500 firms sell, merge, or recapitalize. This year we have already seen14 of such transactions, and given what we are seeing and hearing “on the street,” we fully expect this year to witness close to 30 of the largest design firms in the U.S. change hands. That number will be closer to 50 including environmental firms.
Deeper dive: Check out Jon Escobar’s commentary and infographic for a more comprehensive analysis of 2021’s first half M&A stats and trends.
Industry consolidation at historic highs: This week we reported 12 new transaction announcements. The pace of M&A activity is up 30% over last year with no end in sight. We will break the 400-deal milestone this year.
Texas M&A Symposium update: We’re adding new panelists, including recent Texas dealmakers to this signature event. Join over 100 industry CEOs, M&A decision makers, and investors from Texas and around the nation for the 7th Texas M&A Symposium. We’re thrilled to co-produce this event once again with our friends at ACEC Texas. Thanks to our wonderful symposium partners (Lawson & Weitzen and DGC) and sponsors (BSTGlobal and Ames & Gough).
What we’re tweeting about this week: We enjoyed this whacky (or is it?) survey. “Americans are willing to take pay cuts to never go into the office again.”
Questions? Insights? Is industry consolidation good or bad for your firm? Email Mick Morrissey @ [email protected] or call him @ 508.380.1868.
Four Factors to Watch
1. Infrastructure Bill
The $1 trillion infrastructure bill would widen the federal budget deficit by $256 billion over 10 years, according to an article appearing in the Wall Street Journal. While the information was circulated as the Senate worked on amendments for the bill last week, it hasn’t yet appeared to be a threat to derail the passage of President Biden’s economic agenda.
Members of the bipartisan group of negotiators who crafted the infrastructure bill, which would call for an additional $550 billion in spending above expected federal levels, had already stated they expected analysis from the Congressional Budget Office (CBO) to show a different estimate because the study wouldn’t account for measures such as repurposing unused COVD-19 aid. The difference in estimates is significant: lawmakers claim the measure will save $210 billion, while CBO estimates indicate a $13 billion savings over 10 years. While 17 Republicans sided with all 50 Democrats on the initial procedural vote two weeks ago, they will need to be convinced of these cost measures to ultimately support the bill.
2. COVID-19 Case Numbers
In the last week, the seven-day average of daily COVID cases in the U.S. surged from over 71,200 to nearly 100,200. August 5 saw over 127,500 cases. The seven-day average has not been this high since February 11.
Seven-day averages of COVID cases increased in California, Texas, and Florida:
- California: from 8,048 to 10,520
- Texas: from 7,777 to 11,582
- Florida: from 13,505 to 18,120
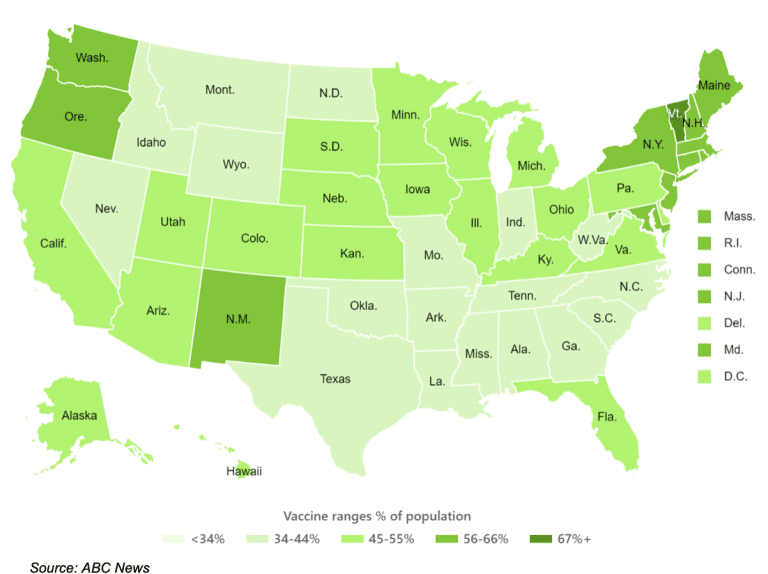
3. Vaccination Rates
Every state in the U.S. has reported an increase in its average number of first doses administered in the last three weeks, with the national rate of Americans receiving their first dose up by more than 73%, according to data gathered by ABC News.
In one week, vaccination rates have increased by nearly 20% for children ages 12 to 17 and by more than 25% for adults. A week ago, the White House reported a fifth straight day of more than 700,000 daily doses being administered, up 24% over a two-week span.
Because of the Delta variant, which now accounts for 8 out of 10 new cases in the U.S., some health experts now believe that 85%-90% of the population will need to be vaccinated to bring the pandemic under control. Currently about half of the country’s population has been fully vaccinated.
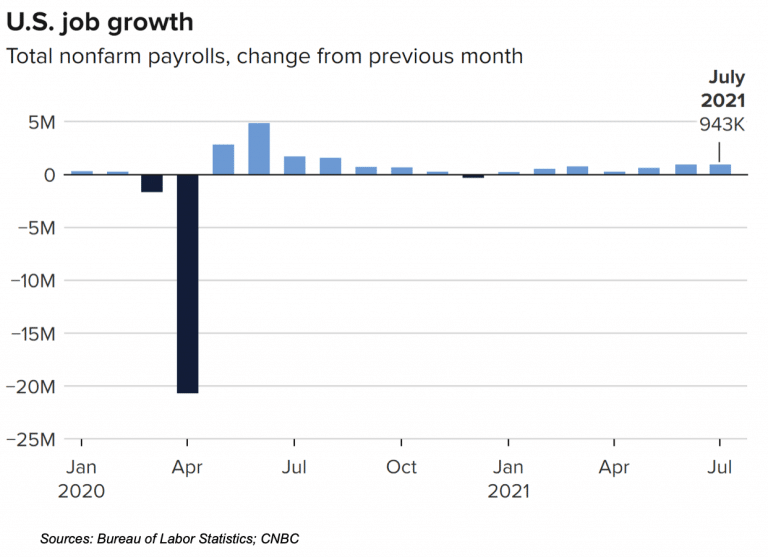
4. Employment
Jobless claims dropped by 24,000 to 400,000 last week—still almost double the number of claims reported just before COVID struck almost a year and a half ago. The four-week moving average, which smooths out volatility in the weekly figures, inched up to 394,500.
While employers added 850,000 jobs in June (the most in 10 months) and workers’ wages also increased, employers are having an increasingly harder time finding workers and paying those higher wages.


Subscribe to our Newsletters
Stay up-to-date in real-time.