Market research > 50 in 50: North Dakota, South Dakota, and Wisconsin
50 in 50: North Dakota, South Dakota, and Wisconsin
At-a-glance snapshots of key market indicators in various market sectors and geographies.

50 in 50: North Dakota, South Dakota, and Wisconsin
50 states in 50 weeks: U.S. states economic and infrastructure highlights.
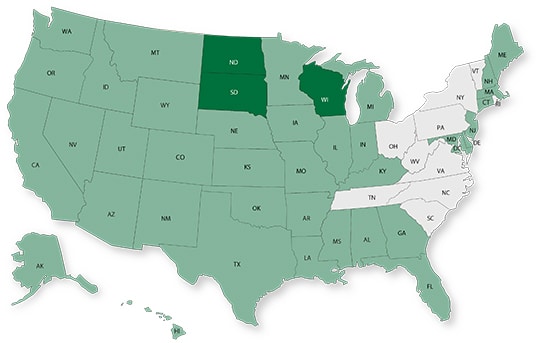
Our team is putting together new content and a different format to kick off 2023 Word on the Street. For that reason, we will be publishing the remaining states of the 50 in 50 Series in a combined fashion. This week we are featuring the last three states in the Midwest: North Dakota, South Dakota, and Wisconsin
Key Economic Indicators
| Measure | North Dakota | South Dakota | Wisconsin |
| GDP (billions) | $55.7 | $49.0 | $302.8 |
| GDP 5-year CAGR | 0.8% | 1.6% | 0.9% |
| GDP per capita (U.S.: $58,154) | $71,657 | $54,702 | $52,025 |
| Population (millions) | .775 | .895 | 5.9 |
| Population 5-year CAGR (U.S.: 0.5%) | 0.6% | 0.6% | 0.4% |
| Unemployment (U.S.: 3.7%) | 2.3% | 2.4% | 3.3% |
| Economic outlook ranking | #9 | #12 | #14 |
| Fiscal health ranking | #2 | #5 | #17 |
| Overall tax climate ranking | #19 | #2 | #27 |
* Compounded annual growth rate (2017-2021)
Top three industries by GDP Growth (last five years):
| # | North Dakota | South Dakota | Wisconsin |
| #1 | Agriculture, forestry, fishing and hunting |
Mining, quarrying, and oil and gas extraction |
Information |
| #2 | Manufacturing | Agriculture, forestry, fishing and hunting | Military |
| #3 | Federal civilian | Administrative and support and waste management and remediation services |
Management of companies and enterprises |
Areas with the highest population percentage increase in 2021 vs. 2020:
| # | North Dakota | South Dakota | Wisconsin |
| #1 | Fargo, ND-MN Metro Area | Rapid City, SD Metro Area | Eau Claire, WI Metro Area |
| #2 | Bismarck, NA Metro Area | Sioux Falls, SD Metro Area | Janesville-Beloit, WI Metro Area |
| #3 | Jamestown, ND Micro Area | Spearfish, SD Micro Area | Green Bay, WI Metro Area |
Infrastructure Highlights
North Dakota received a ‘C’ grade on its last report card from the ASCE, with the worst categories being bridges and dams. According to the ARTBA, after one year of Bipartisan Infrastructure Law (BIL), the state has started 358 transportation projects. To date, $130 million has been announced for water infrastructure as well as significant funds for flood protection projects.
South Dakota has not started transportation projects at the same pace as its northern neighbor, but work is underway with large projects on I-90, I-29, and US 81. Over $167 million was recently announced by the Department of Agriculture and Natural Resources (DANR). The funds will be deployed as grants and loans for drinking water, wastewater, and solid waste projects in the state.
Wisconsin’s road and transit infrastructure were graded as poor in its 2020 ASCE scorecard. The state was able to start 719 projects to improve bridges and highways since the BIL passed. A significant portion of funds was tagged for improvements on I-43. Wisconsin is the state with the most lead pipes per capita, which is why service line replacements will be a priority for the $150 million announced thus far for water infrastructure.
AE Industry
| AE Industry Metric | North Dakota | South Dakota | Wisconsin |
| ENR 500 firm headquarters | 0 | 0 | 13 |
| M&A buyers since 2018 | 8 | 9 | 24 |
| M&A sellers since 2018 | 7 | 2 | 21 |
For customized market research, contact Rafael Barbosa at [email protected] or 972.266.4955. Connect with him on LinkedIn.


Subscribe to our Newsletters
Stay up-to-date in real-time.