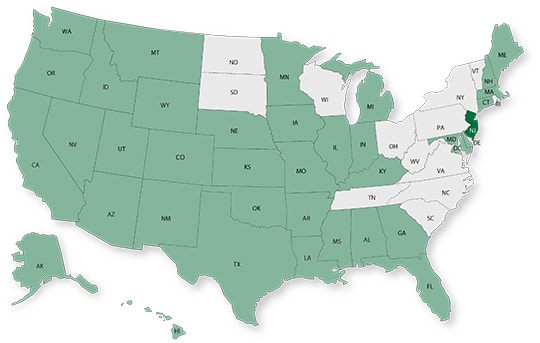
Market research > 50 in 50: New jersey
50 in 50: New Jersey
At-a-glance snapshots of key market indicators in various market sectors and geographies.

50 in 50: New Jersey
50 states in 50 weeks: U.S. states economic and infrastructure highlights.

Key Economic Indicators
GDP: $561.8 billion
GDP 5-year compounded annual growth rate (CAGR) (2017-2021): 1.1% (U.S.: 1.6%)
GDP per capita: $61,805 (U.S.: $58,154)
Population: 9.2 million
Population 5-year CAGR (2017-2021): 1.0% (U.S.: 0.5%)
Unemployment: 3.3% (U.S.: 3.9%)
Economic outlook ranking: #49 out of 50
Fiscal health ranking: #49 out of 50
Overall tax climate ranking: #50 out of 50
Key Sectors and Metro Areas
Top five industry sectors by 2021 GDP:
Top three industry sectors by GDP 5-year CAGR (2017-2021):
Top three metro areas by GDP*:
- Trenton-Princeton
- Atlantic City-Hammonton
- Vineland-Bridgeton
*Excludes areas for which the principal city is not in New Jersey (i.e., New York-Newark-Jersey City, NY-NJ-PA)
Top areas by population percentage increase in 2021 vs. 2020:
- Ocean City, NJ
- Atlantic City-Hammonton
- Vineland-Bridgeton
Infrastructure Highlights
New Jersey has identified over 45 projects for more than $3 billion in funding the state has been allocated thus far as part of the Bipartisan Infrastructure Law (BIL). According to a 2021 report by TRIP, New Jersey’s interstate highways were in poorer condition than 48 other states. Additionally, 57 percent of major roads in New Jersey are in poor or mediocre condition. Of the $169 million made available for water projects in the state in 2022, $48 million is dedicated to lead pipe and service line replacement, and another $30 million for drinking water investments. According to the New Jersey Department of Environmental Protection, the demand for water infrastructure projects is at an all-time high and many of the projects identified will not get funded despite availability of more federal money. Over the next five years, New Jersey’s BIL funds will address the following categories of projects (additional funds may be deployed as federal grants get awarded to states):
Construction spending (Value of Construction Put in Place – CPiP):
- Private Nonresidential 2021 CPiP: $6.3 billion; -0.5% 5-year CAGR (2017-2021), below overall U.S. CAGR of 1.4%
- State & Local 2021 CPiP: $5.8 billion; 3.0% 5-year CAGR (2017-2021), below overall U.S. CAGR of 4.0%
AE Industry
ENR 500 firm headquarters (2022): 10
M&A activity since 2018:
- 29 deals with buyers from New Jersey
- 41 deals with sellers from New Jersey
For customized market research, contact Rafael Barbosa at [email protected] or 972.266.4955. Connect with him on LinkedIn.
Subscribe to our Newsletters
Stay up-to-date in real-time.


