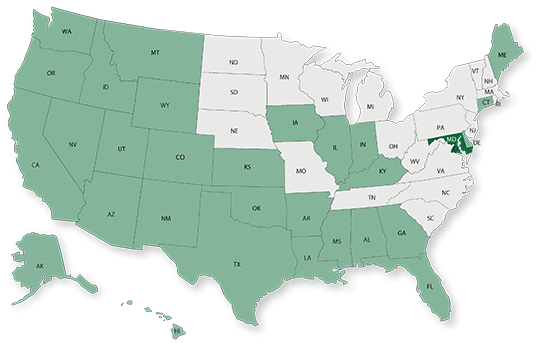
Market research > 50 in 50: maryland
50 in 50: Maryland
At-a-glance snapshots of key market indicators in various market sectors and geographies.

50 in 50: Maryland
50 states in 50 weeks: U.S. states economic and infrastructure highlights.

Key Economic Indicators
GDP: $364.2 billion
GDP 5-year compounded annual growth rate (CAGR) (2017-2021): -0.2% (U.S.: 1.6%)
GDP per capita: $59,616 (U.S.: $58,154)
Population: 6.2 million
Population 5-year CAGR (2017-2021): 0.6% (U.S.: 0.5%)
Unemployment: 4.3% (U.S.: 3.9%)
Economic outlook ranking: #37 out of 50
Fiscal health ranking: #37 out of 50
Overall tax climate ranking: #46 out of 50
Key Sectors and Metro Areas
Top five industry sectors by 2021 GDP:
Top three industry sectors by GDP 5-year CAGR (2017-2021):
Top three metro areas by GDP:
- Baltimore-Columbia-Towson
- Salisbury
- Hagerstown-Martinsburg
Top three metro areas by population percentage increase in 2021 vs. 2020:
- Salisbury
- Hagerstown-Martinsburg
- California-Lexington Park
Infrastructure Highlights
Infrastructure: ASCE Infrastructure Grade (2020): C
Systemic budget shortfalls and a continuing decline in ridership have contributed to poor transit infrastructure conditions in Maryland. Additionally, the latest White House update on the Bipartisan Infrastructure Law (BIL) indicated that the state has 273 bridges and over 2,201 miles of highways in less than mediocre condition. A total of $1.3 billion has been assigned to state transportation agencies this year, which will be used in combination with the state’s Consolidated Transportation Program (CTP) for improvement projects over the next six years. In September, Maryland received approval to access $23 million to install about 3,500 charging ports along its main interstate corridors.
As it relates to water infrastructure, the state can tap into the $144 million that was assigned from the federal government this year. In addition to lead pipe replacement and PFAS chemicals, projects will tackle improvements aimed at preventing situations like boil warnings due to E.coli contamination, which affected certain areas of Baltimore earlier this month. Over the next five years, Maryland’s BIL funds will address the following categories of projects (additional funds may be deployed as federal grants get awarded to states):
Construction spending (Value of Construction Put in Place – CPiP):
- Private Nonresidential 2021 CPiP: $4.1 billion; 3.8% 5-year CAGR (2017-2021), above overall U.S. CAGR of 1.4%
- State & Local 2021 CPiP: $5.0 billion; -2.2% 5-year CAGR (2017-2021), below overall U.S. CAGR of 4.0%
AE Industry
ENR 500 firm headquarters (2022): 9
M&A activity since 2018:
- 56 deals with buyers from Maryland
- 39 deals with sellers from Maryland
For customized market research, contact Rafael Barbosa at [email protected] or 972.266.4955. Connect with him on LinkedIn.
Subscribe to our Newsletters
Stay up-to-date in real-time.


